


Beyond Margins: Understanding Asset Turnover and What It Reveals
Not All Winners Have the Fastest Car - Some Just Use It Better


Have you watched the movie - Ford vs Ferrari?
If not, you should. Not just because it’s a great movie. But because buried under the wheel revs, rivalry, and roaring engines is one of the most interesting business case studies you’ll ever come across.
If you’ve not seen the movie, for the sake of this blog - I’ll give you guys a quick context.
It’s 1966. Ferrari is the undisputed king of Le Mans. Along comes Ford - an outsider with something to prove. Now, what starts as a corporate clash of egos turns into one of the greatest underdog stories in automotive history.
But amidst the thrill and emotions - and erm memes -

here’s the part that gets overlooked:
Ford didn’t win because they made the fastest car. They won because they out-thought the system.
Under Carroll Shelby’s (Matt Damon) leadership, and with Ken Miles (Christian Bale) behind the wheel, the GT40 was reimagined :
The body was redesigned for aerodynamic stability
The chassis was lighter but tougher - built for 24 hours of brutality
A monstrous 7.0-litre V8 gave it the grunt
A revolutionary quick-change brake system - an edge that shaved off critical pit time Ferrari couldn’t afford.
[The technical details run deep - but trust me, it’s worth watching the movie. Just know this: they got the job done.]
Same rules. Same track. But a different outcome.
Why? Because Ford didn’t just race harder - they raced smarter.
They found leverage in design, discipline in systems, and speed through smart thinking.
Now, turn that lens to the world of investing.
Everyone’s busy hunting the next compounder - and most screens echo the same query in them: Net Profit Margin > 10%. The logic? High margins signal pricing power, efficiency, and a so-called moat.
But here’s the twist nobody talks about:
Some of the best businesses don’t grow fat - they grow fast.
Yes, high-margin companies often hog the limelight. But low-margin, high-velocity models - where asset turns move the needle - are just as powerful.
Think of them as the GT40s of the business world - Taking out the competition over and over again - by just producing more - producing fast.
And in investing, that’s often what makes all the difference. If you think this is just theory, here’s a simple thought experiment for you.
Let’s meet two companies:

On the surface, Company X looks like the classic winner - fat margins, steady returns. Your screener would probably give it a thumbs-up just for that 10% NPM.
But look again.
Company Y is a velocity machine. It turns its assets 4x in a year, churning out ₹600 Cr in revenue on the same asset base. Yes, its margins are thin. But it compensates with speed. And what do shareholders care about in the end? Yes, it is Return on Equity.
Company Y delivers a 21% RoE vs. 15% for Company X.
Let’s break down a core concept that any investor needs to closely analyse: Asset Turnover Ratio (ATR), as it is one of the most important things and is often overlooked.
The Hidden Gears Behind Asset Turnover
At its simplest, asset turnover tells you how efficiently a company uses its assets to generate sales. However beyond efficiency, asset turnover also hints at entry barriers and competitive intensity.
Capital-intensive businesses with low asset turnover often face tougher growth paths, needing continual capital to scale, while also enjoying protection from new entrants due to high startup costs. Let’s understand this further.
If a company has an ATR of 4x, it means every ₹1 invested in assets produces ₹4 in revenue. Superb right? Yes, it is true that a high-turnover business can scale faster without constantly going back to the equity or debt markets - but on the flipside it will also attract competition.
On the other hand, another company that has a lower ratio of 0.5x suggests that only ₹0.5 revenue is generated for every ₹1 invested in assets.
Well, it tells you the business is more capital intensive - it needs more money locked in machinery, infrastructure, or working capital just to generate each rupee of sales.
Low asset turnover businesses often face a double-edged sword and tells us a couple of things at a minimum:
One - They require constant capital infusion to fund growth and more demand from the shareholders (interest cost / earnings dilution)
Two - They operate in industries with high entry barriers - which is good for incumbents, but can slow growth and stress return metrics over time if capital isn’t deployed wisely.
But here’s the nuance:
ATR is most meaningful when comparing companies within the same industry.
Our earlier comparison of Company X and Company Y was meant to highlight the broader point about capital efficiency - not to draw apples-to-apples conclusions. You wouldn’t compare a high-turnover FMCG distributor to a capital-heavy specialty chemicals manufacturer and expect insight.
Every industry has its own rhythm - some need heavy upfront investments to even get off the ground, while others are nimble, asset-light, and built for speed from day one.
Let’s take a quick tour:
Capital-Intensive Industries (Low ATR): Think cement, power, steel, infrastructure. These businesses require massive investments in land, plants, machinery, and utilities - all of which sit on the balance sheet as fixed assets. Sales grow slowly relative to assets, so ATRs tend to hover around 0.3x to 1x. But these businesses often enjoy high entry barriers.
Retail, FMCG, and Distribution (High ATR):
Companies like DMart, Hindustan Unilever, or logistics players can generate ₹3–6 of revenue for every ₹1 invested in assets. Why? Because they’re built for velocity. Inventory moves fast, and physical infrastructure is relatively lean. ATRs can go as high as 3x to 6x. Not much of an entry barrier.Pharma & Chemicals (Mid ATR):
These sectors are a mixed bag. Innovator pharma or specialty chemicals may be capital-intensive early on (R&D, plants), but once established, they can scale well. Typical ATRs range from 1x to 2x, but vary widely based on product mix and export share.Tech & Services (Varies widely):
Software companies or asset-light service businesses often have minimal fixed assets, leading to very high asset turnovers - sometimes > 6x - though the usefulness of ATR here is limited because “assets” on the balance sheet don’t reflect their real capital: people and IP.
Essentially, relying solely on a single metric like the asset turnover ratio doesn’t paint the full picture of a company’s financial health.
Smart investing requires a holistic view - combining multiple factors, ratios, and business insights before making any decision. A number alone rarely tells the whole story.
Behind the Numbers: What Really Drives RoE?
Now that we are at it, let’s circle back to our earlier pit stop - Company X vs. Company Y.
At first glance, you’d think Company X - with its high margins should’ve taken the trophy. But it didn’t. Company Y, despite razor-thin profits on each rupee of sales, ended up delivering a higher Return on Equity.
That’s where a beautiful little framework called the DuPont Analysis.
See, RoE is one of those superstar metrics investors love to quote. But few stop to ask what really drives it. The answer?
Imagine RoE is the final lap time in a Formula 1 race. There are three things that determine how fast you finish:
Your engine power – that’s your Net Profit Margin (how much you earn after subtracting everything per sale)
How many laps you can do in a given time – that’s your Asset Turnover Ratio (how efficiently you use what you own)
How light your car is – that’s your Leverage (how much equity you’re carrying versus debt)
In formula terms:
RoE = Net Profit Margin × Asset Turnover × Financial Leverage (Assets/Shareholders’ Equity)
So let’s plug in our two contenders considering equal leverage:
Company X: Fat margins (10%), but it’s slow around the track (ATR = 1x)
Company Y: Thin margins (3.5%), but it laps the circuit 4x faster (ATR = 4x)
Even with inferior net profit margins, Company Y ends up compounding harder - because it knows how to run lean and fast.
RoE isn’t magic, it’s mechanics.
And that’s what DuPont tells us - Break it down, and suddenly you start seeing why some companies outperform - and others stall.
So next time you come across a business with an RoE north of 20% and the other company within the same industry operating at sub 15%, ask yourself: Is the former company riding on fat profits? Fast cycles? Or just clever use of leverage?
Because knowing the answer makes all the difference.
Anyway, let us take a case study to further drive home the importance of this financial ratio.
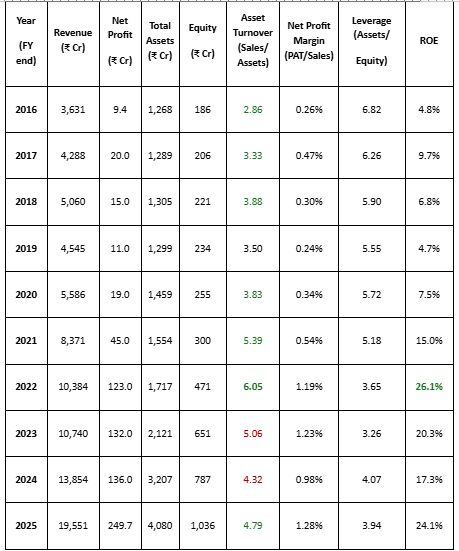
Gokul Agro Resources Ltd (FY2016–FY2025)

[Disclaimer: No investment advise. Not Invested. This is just for illustration and learning purpose only.]
Gokul Agro Resources (Gokul) is an edible oils and agri-products company that has rapidly expanded since 2016.
Its consolidated revenues surged from ~₹3635 crores in FY2016 to ~₹19,550 crores in FY2025. Over this period Gokul invested heavily in new refineries and crushing plants (for example, adding a 1,400 TPD refinery in FY2022 and a 100 TPD unit in FY2025). As a result, total assets more than tripled from ~₹1268 crores in FY2016 to ~₹4080 crores in FY2025
Meanwhile equity (net worth) grew from only ₹186 cr. in FY2016 to ₹1036 crores in FY2025 (equity capital + reserves: ₹30.0 crores + ₹1006 crores). The net profit rose from just ₹9.4 crores in FY2016 to ₹246 crores in FY2025 (PAT), lifted by higher volumes and improving efficiencies.
These figures are summarized in the tables below.
Table 1. Gokul Agro (Consolidated, FY2016–FY2025)
Something was cooking at Gokul Agro Resources - and it was not just edible oils.
Back in 2016, Gokul Agro was a modest mid-tier agri-processor, battling low margins and high leverage. Its asset turnover ratio hovered just below 3x and equity multiplier or leverage almost 7x. Yet the ROE was below 5% owing to poor ATR and margins.
However, even though the margins remained subdued i.e below 1%, the financial leverage was continuously on a decline. But one thing which was quietly improving was the efficiency. On a relatively stable base, the company improvised its efficiency and scaled its ATR from 2.8x t0 5.4x. The company exited FY21 with an ROE 15%.
And this is when the market truly started appreciating the business. The stock which was trading at Rs. 20/Share on 1st April 2021, it touched Rs. 123 on 29th April 2022 as the ROE improved to 26% and peak Asset Turns!
And the market? It noticed.
It made a 6x move in a year! Mind you the NPM was just ~1.2% that year!!

Source: screener.in
It doesn’t end here. The business momentum continued.
As the company invested in capacity expansion in 2023 - 2025, the balance sheet bulked up. Asset additions meant ATR dipped briefly. As new plants ramped up, ATR started improving again, reflecting better asset sweating.
But what about ROE? As you can see it
Gokul's ROE improved not just because of financial leverage, but increasingly because of improving asset efficiency. NPM remained in the 1.5–2% zone - typical for a commodity business - but better throughput and capacity utilisation began playing a larger role.
Between March 24 and Mar 25, the share price has more than doubled, moving in tandem with improving ratios and cleaner disclosures.
The table above also illustrates how Gokul’s asset base expanded dramatically in FY2023–25, via greenfield expansions and acquisitions, causing a temporary dip in asset turnover (Font in RED). Of course, as is the case, the ramp up and stabilization takes time for these new assets. The full benefits of the company’s expanded capacity were partially seen in FY25 (check the ATR - it has started recovering) and are further expected to be reflected in FY26 as well, with improved utilisation likely to drive stronger margins and top line growth.
This development will further take the ratio closer to its peak by the end of FY26.
However, as is the case, a high Asset Turnover Ratio attracts high competition and that is a perennial risk for such companies as there are no entry barriers!
Remember?

Source: Gokul Agro Credit Rating Report October 2024.
[Disclaimer: No investment advise. Not Invested. This is just for illustration and learning purpose only.]
Conclusion: Why Asset Turnover Deserves a Closer Look
So to conclude, Asset Turnover Ratio is often overlooked. Yet it plays a crucial role in understanding a company’s operational efficiency and capital deployment.
As we've seen, it can be a key driver of Return on Equity, especially when margins are modest and leverage is limited.
Through the example of Gokul Agro, we’ve observed how improvements in asset turnover can significantly enhance financial performance and, in turn lead to a meaningful re-rating in the markets.
It also gives insight into the nature of the business - whether it's asset-light or capital-intensive - and the kind of growth runway it might need in terms of investment.
That said, asset turnover is best assessed in the context of the industry, company lifecycle, and in conjunction with other financial metrics. Alone, it won’t tell you everything - but as part of a broader analysis, it adds valuable depth to an investor’s understanding.
In short, asset turnover helps answer a simple yet critical question:
How effectively is the business using what it owns to drive growth?
[Disclaimer: No investment advise. Not Invested. This is just for illustration and learning purpose only.]
 | A guest post by
|
great stuff
keep up the great work and keep posting such insightful learnings!
Delivered the point 💯